
Heating and Cooling
Climate control is often the largest source of household electricity use.

Solar gives you a more predictable way to manage household energy costs. We show you what you pay today, what your system could produce, and how the long-term numbers may change.
Your bill reflects both how much electricity your home uses and how your utility prices that energy. Supply, delivery, rates, fees, and household demand all influence the amount due.
These everyday systems often account for the largest share of a residential electric bill.
Climate control is often the largest source of household electricity use.

Refrigerators, laundry, cooking, and dishwashing create steady daily demand.

Pumps, heaters, and circulation equipment can create large seasonal loads.

Efficient fixtures help, but lighting still contributes throughout the home.

TVs, routers, computers, chargers, and standby devices use energy every day.
Residential account summary
April 2 to May 1
Example only. Actual rates, fees, and usage vary by household and utility.
The more grid electricity your household uses, the more solar may be able to offset.
Higher electricity prices can increase the value of every kilowatt-hour your system produces.
Stored solar energy may reduce evening grid use and provide backup for selected circuits.

Roof direction, tilt, available area, and shading all influence annual production.
A properly sized system balances roof capacity, usage, budget, and long-term goals.
EV charging, heat pumps, additions, and new appliances should be considered before design.
Own your solar system outright and maximize long-term value.
Upfront investment · Strongest long-term ownership
Use predictable monthly payments instead of one large upfront cost.
Flexible terms · Subject to approval
Review available programs that may reduce your effective system cost.
Eligibility varies by location and tax situation
We explain estimated costs, financing assumptions, and incentive eligibility before you make a decision.
Review My OptionsSee a sample of how solar production, utility offset, and projected savings can be presented in one straightforward comparison.
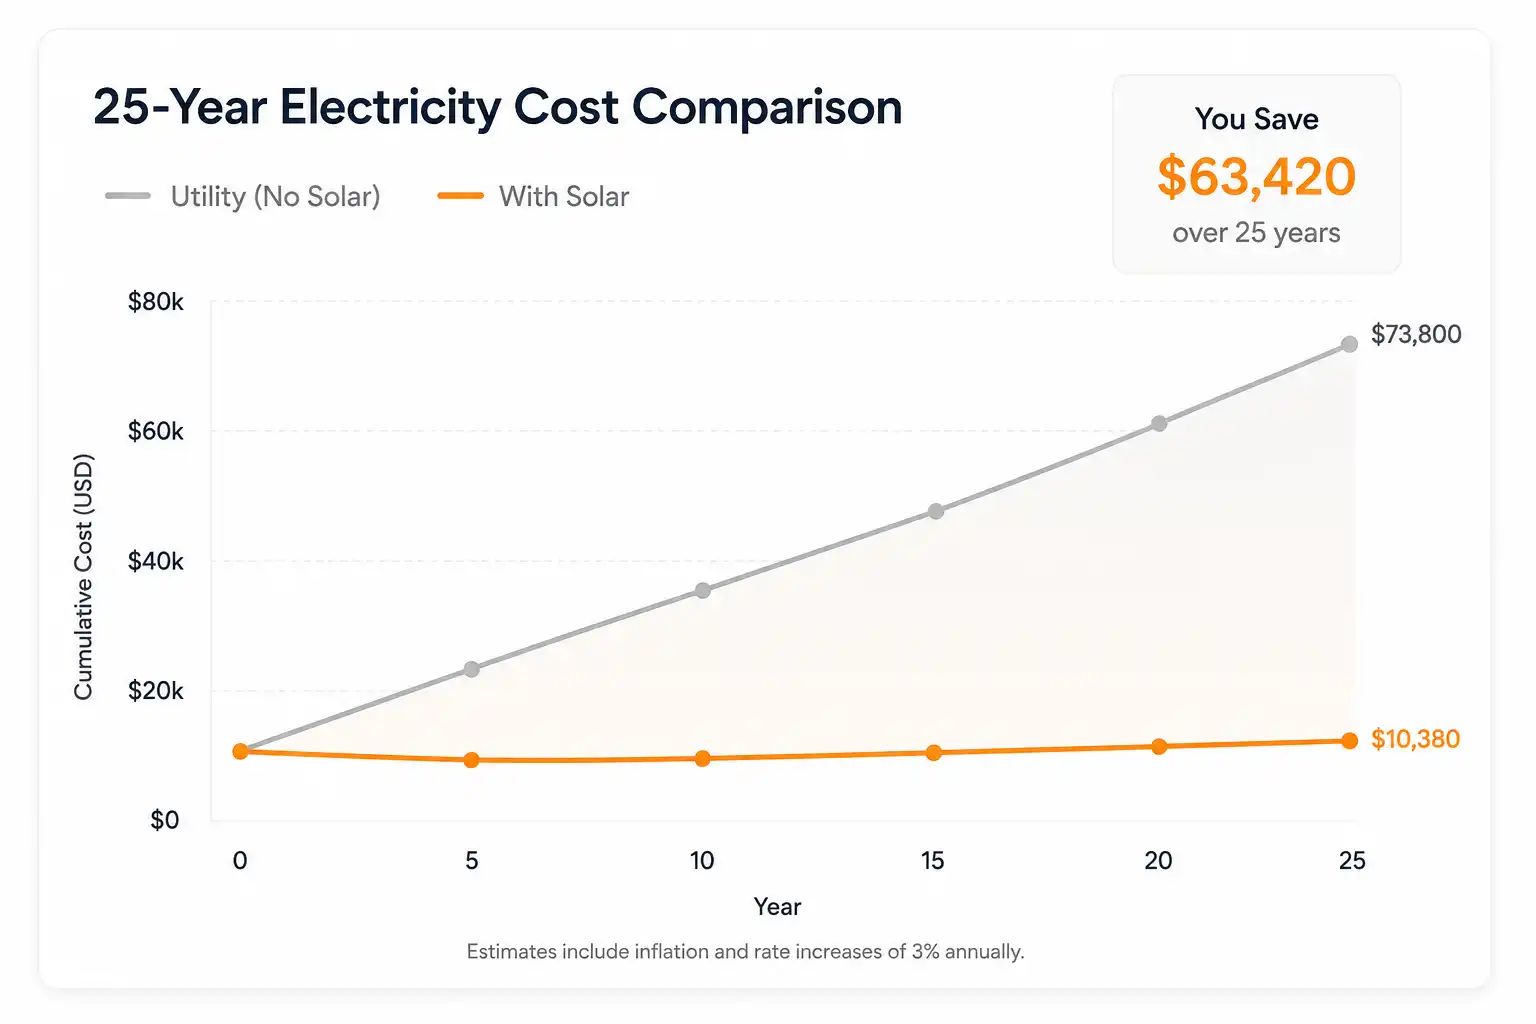
Utility costs without solar compared with projected solar costs.
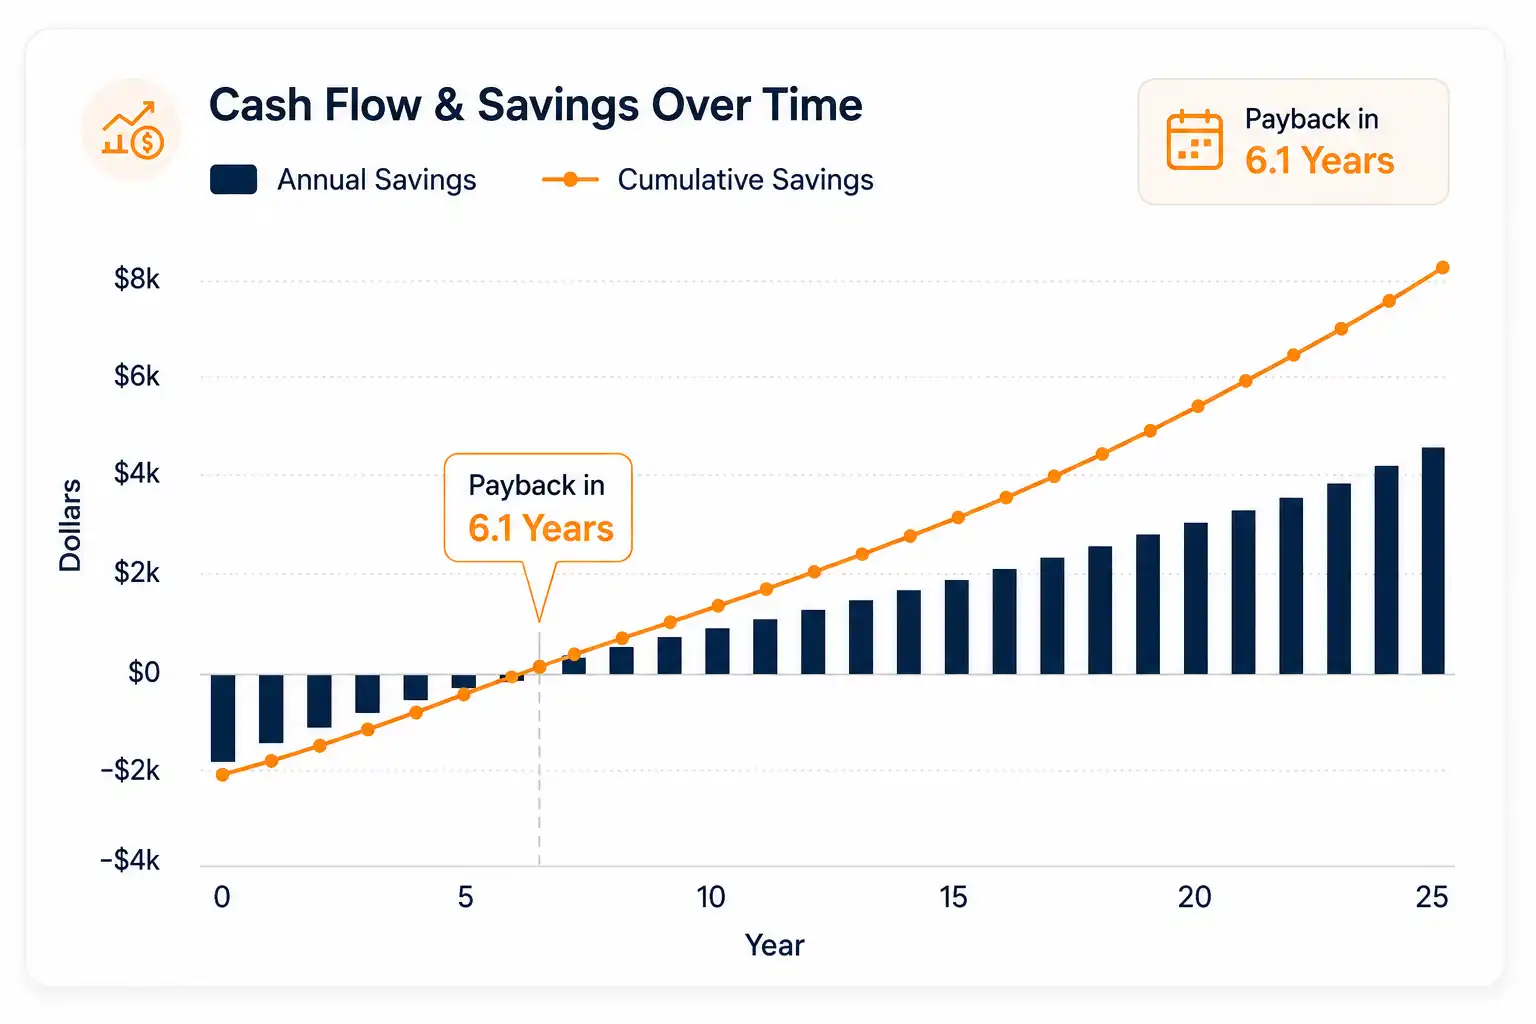
Annual and cumulative savings shown across the system term.